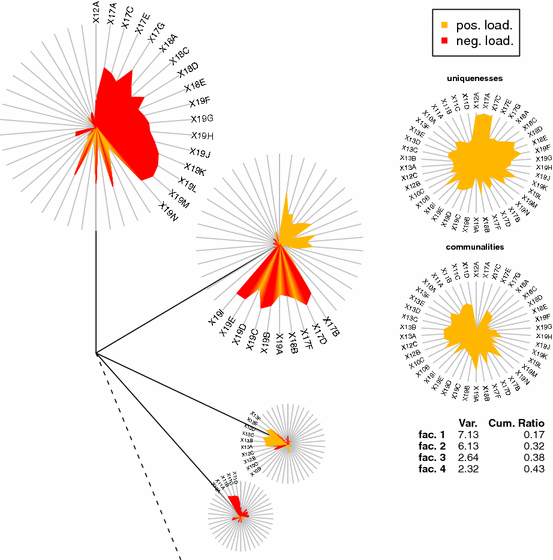
Dandelion Plot
Given a data matrix of \(X\) with \(n\) samples and \(p\) features, a general formulation of a R-mode EFA with \(k < p\) number of factors extracted is: \[X_{nxp}=F_{nxk}A^T_{kxp}+E_{nxp}\] where \(E\) is the error term, \(F\) is the factor score matrix and \(A\) is the factor loading matrix. Dandelion Plot visualizes EFA models which allows the simultaneous visualization of
- the Explained Variance and
- the Factor Loadings \(A\)
where we emphasize the importance of each individual variable associated with their factors. Our visualization method have been employed in several clinical settings covering eating disorders, and image-based tumor phenotyping. We have made Dandelion plot publicly accesible using the R package DandEFA.
People: Erhan Cene, Ahmet Sedef, Ibrahim Demir
| Visualization of Explained Variance | Dandelion Plot |
|---|---|
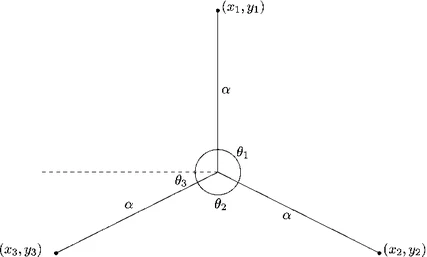
|
|
References
Manukyan, A., Çene, E., Sedef, A., & Demir, I. (2014). Dandelion plot: a method for the visualization of R-mode exploratory factor analyses. Computational Statistics, 29, 1769-1791. URL: https://link.springer.com/article/10.1007/s00180-014-0518-x
Martens, R. M., Koopman, T., Noij, D. P., Pfaehler, E., Übelhör, C., Sharma, S., … & Boellaard, R. (2020). Predictive value of quantitative 18F-FDG-PET radiomics analysis in patients with head and neck squamous cell carcinoma. EJNMMI research, 10(1), 1-15. URL: https://ejnmmires.springeropen.com/articles/10.1186/s13550-020-00686-2
Laskowski, N. M., Halbeisen, G., Braks, K., Huber, T. J., & Paslakis, G. (2023). Factor structure of the Eating Disorder Examination-Questionnaire (EDE-Q) in adult men with eating disorders. Journal of Eating Disorders, 11(1), 34. URL: https://link.springer.com/article/10.1186/s40337-023-00757-4